NP Analyst Quickstart Guide
Overview
NP Analyst is a data integration platform for the de novo prediction of compound biological activities from complex mixtures. It requires matched bioassay and MS-based metabolomics data from a sample set as inputs, and provides both network and table views as outputs.
Let’s get started!
Example files: NP Analyst study
The original bioactivity table and the MS-files (zipped .mzML files), used in the NP Analyst study, can be downloaded here:
Step 1: Enter Project Information
If you like you can provide an email address where we can send the link to your results files, and a description of the analysis you are running. If you don’t want to supply your email address then be sure to copy the job number after you submit the job so that you can access the results.
Step 2: Upload Bioassay data
The bioassay file must be a csv file containing sample names in the first column, and bioassay results in the following columns. The minimum number of bioassay results is one, but the resolution and accuracy of the bioactivity predictions will increase if more bioassay data are included. If creating the csv file from Excel, choose File→ Save As… →CSV UTF-8 (Comma delimited) (.csv).
We strongly recommend that bioassay data be normalized prior to analysis with NP Analyst. For full details about file normalization, formats etc. Please see the bioassay file section in the full documentation.
STEP 3: Upload Mass Spectrometry Data
NP Analyst accepts MS data in three open data formats; mzML, csv (from MZmine) and graphML (from GNPS). Just select the desired option in the MS upload page and then upload your file(s). If you import mzML files then NP Analyst will perform replicate comparison and alignment. If you select MZmine or GNPS then you should use the methods in those tools to process individual samples into a single output file and upload a single combined results file. There are instructions for how to do this in the mass spectrometry section of the documentation. NP Analyst also supports the upload of single compressed zip files that contain mzML files.
NOTE: Currently we cannot accept zip files from the native Mac OSX ‘compress’ tool because this creates hidden files in the zip that interfere with the uploader. A solution for Mac users is to use the third party compression tool Keka and to select the ‘Exclude Mac resource forks’ checkbox
It is important that the sample names in the MS file align with the sample names in the bioassay file. For details on this see the sample naming section in the documentation.
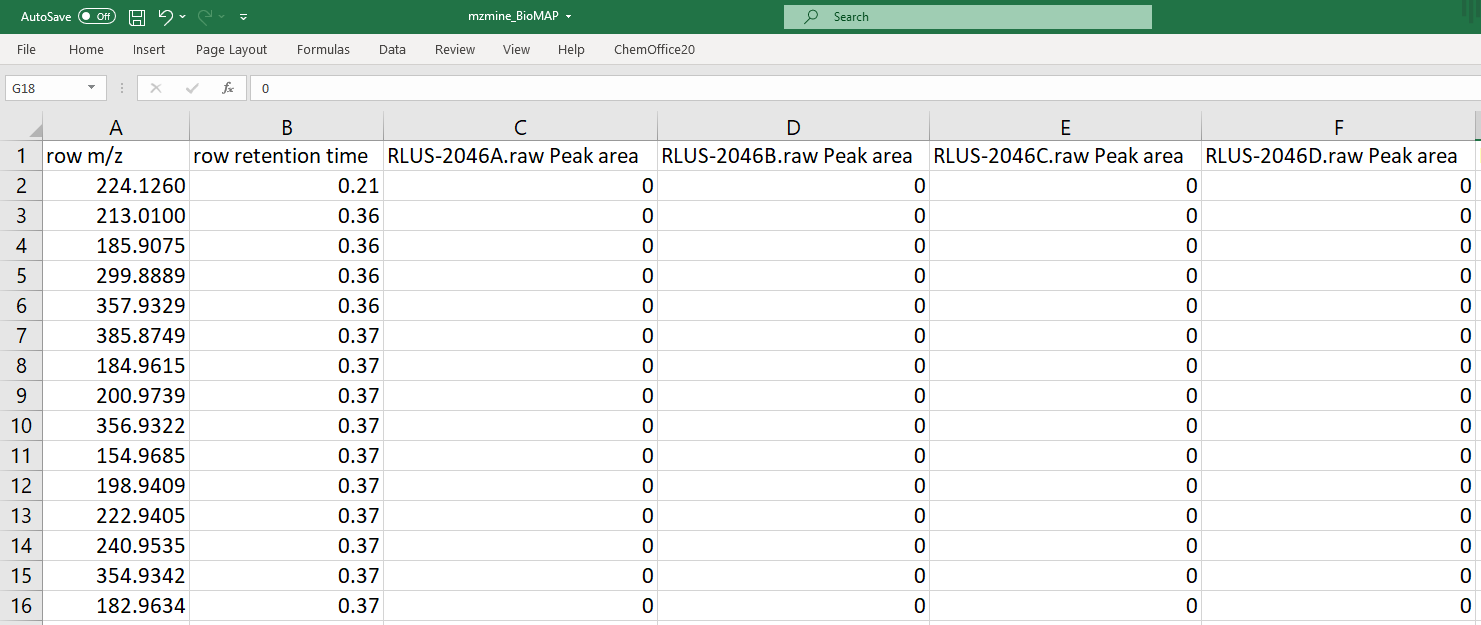
An example MZmine file is depicted here:
Step 4: Set Analysis Parameters
Users have the option to set cutoffs for both Activity Score and Cluster Score. Details about these scores are provided in the analysis section of the documentation. Recommended default values are:
- Activity Score: 0.1
- Cluster Score: 0.1
To see all MS features set Activity Score to 0 and Cluster Score to -1. Be warned that this makes the graphs very large, which makes them much harder to interpret and much slower to display in both online and offline tools.
If you upload .mzML files then you can optionally set a minimum intensity value for MS features. Note that setting this value to 0 is likely to include a very large number of low intensity baseline features that will complicate the analysis. Baseline selection is instrument-dependent, but reasonable starting values are:
-
Waters qTOF instruments: 2,000 (2E3)
-
Thermo Orbitrap instruments: 100,000 (1E5)
STEP 5: Run Analysis
After you press submit be sure to copy the job number and save it somewhere safe. If you supplied an email address we will email this to you once the job is complete.
STEP 6: Review Results
Once the job is complete you can access the results by searching by job number, or clicking the link in the results email. The results page includes three main visualizations:
Scatter Plot
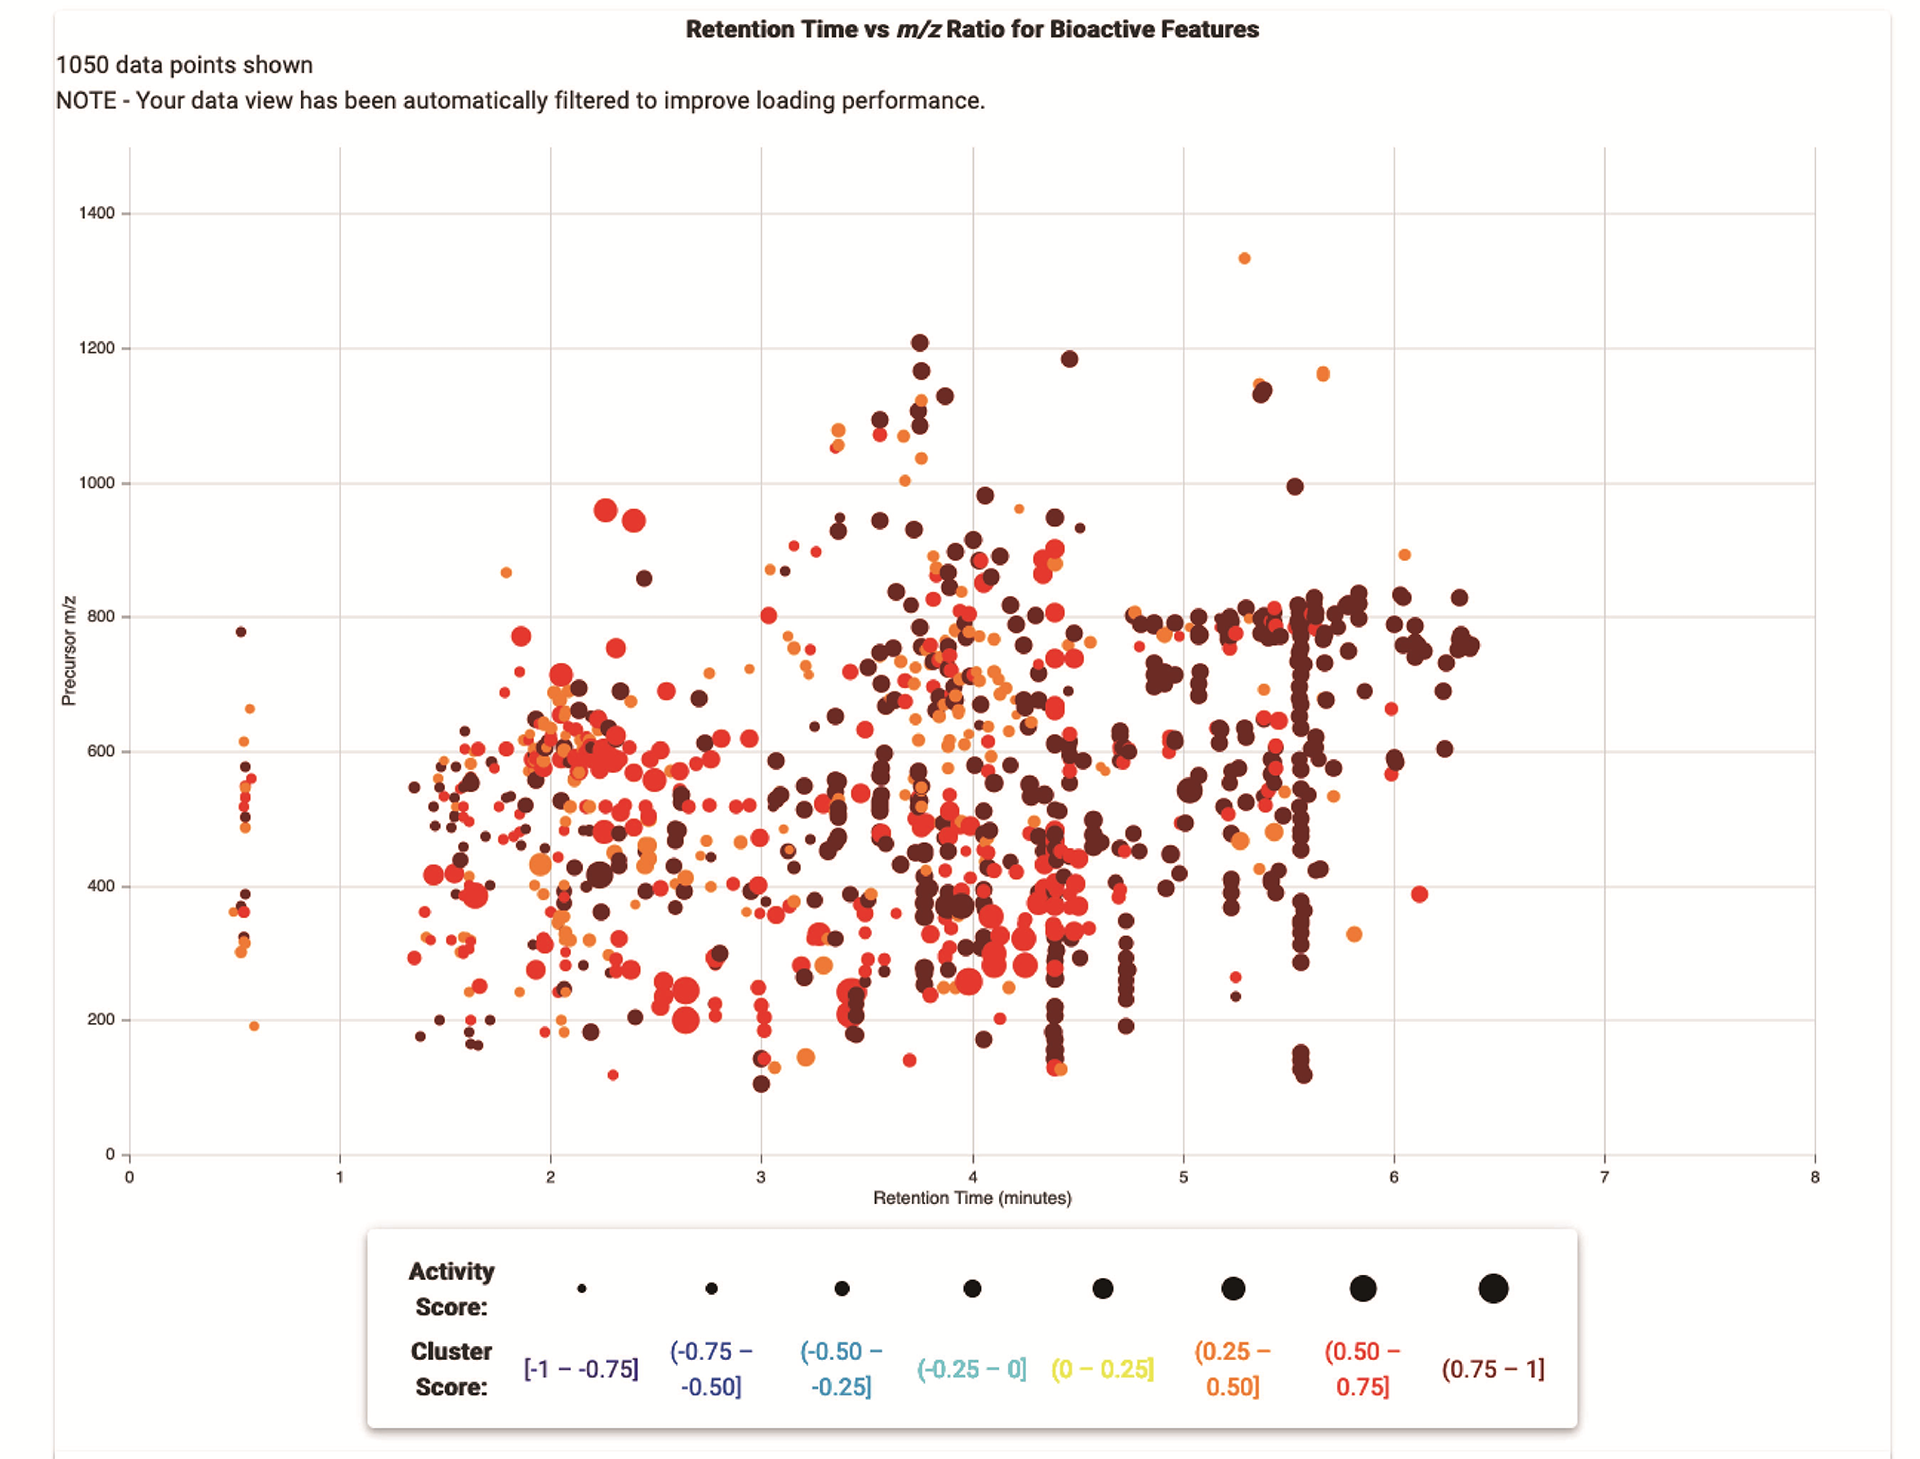
The scatter plot displays MS features for all samples in a single plot. You can filter this plot using the sliders below, and review and export the selected data in the table at the bottom of the page. As a first step, try increasing the minimum Cluster Score, or selecting specific samples in the sample selection pane on the right. Or, try selecting individual data points from the plot, and reviewing the detailed information for each one in the table below.
The size of the data points is proportional to their Activity Scores, while their colors are related to their Cluster Scores.
Network View
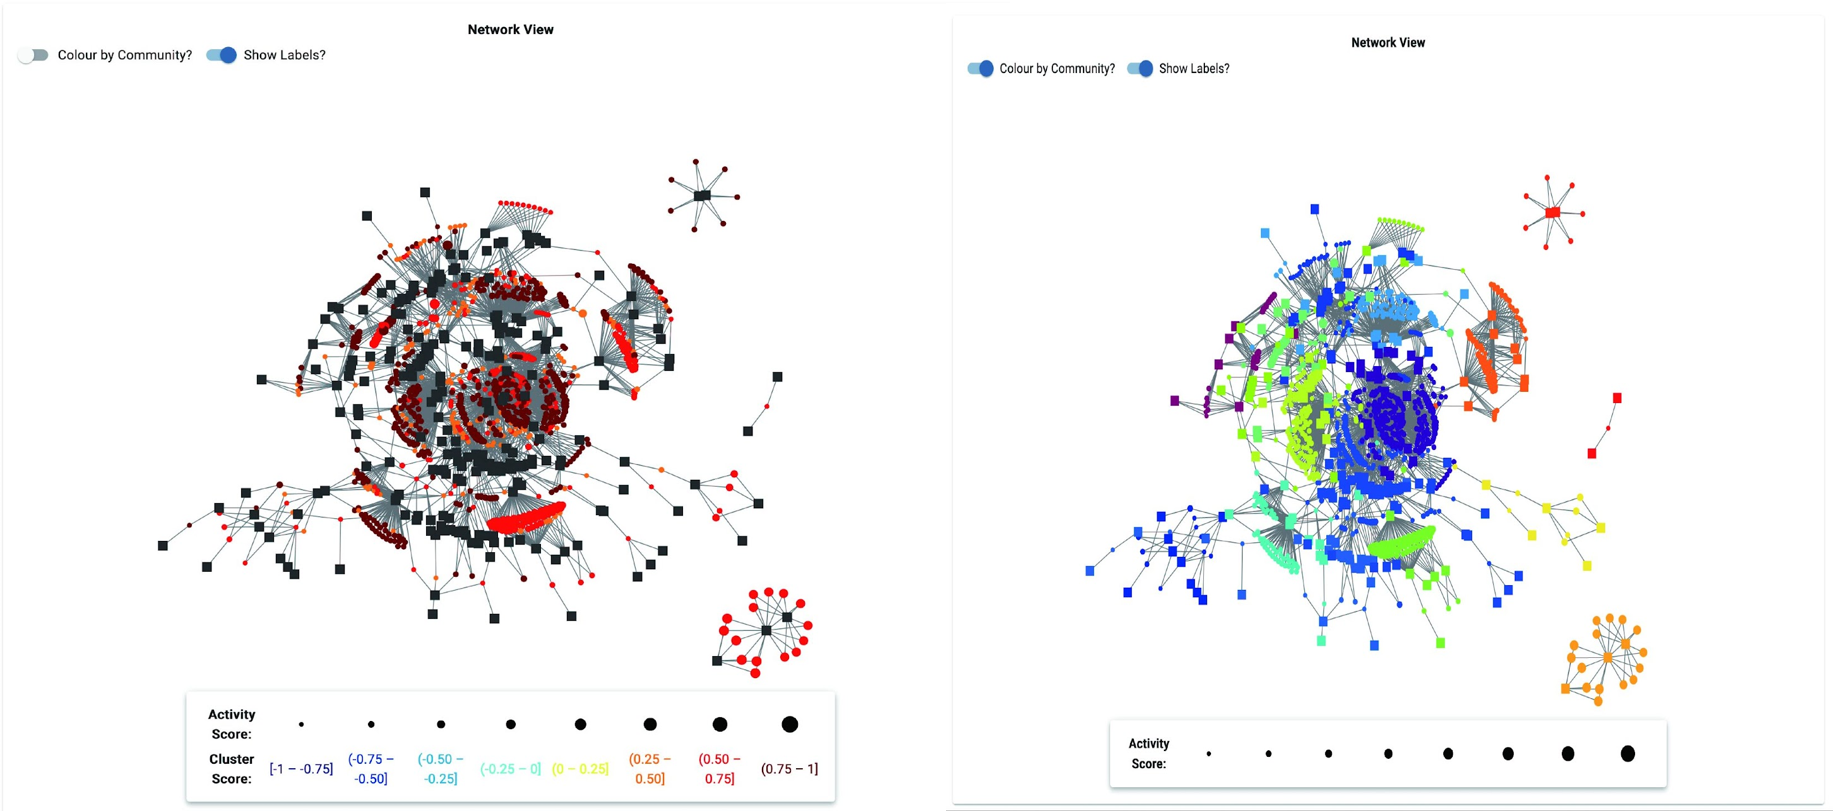
The network view presents a global representation of all the bioactive MS features in the sample set, and the samples that they are present in. Sub-clusters within this network highlight samples that are connected by the same MS feature or set of features. The network view can be used to locate specific samples or MS features of interest, and to place these features in context within the sample set.
If your network is very large it may render slowly in the online network viewer. In these cases you can download the network file from the Downloads page and open it in the desktop version of Cytoscape or Gephi (two open source network visualization platforms).
If you did not set minimum Activity Score and Cluster Score cutoffs then this network will display all MS features and their connections to samples. This typically creates ‘hairball’ networks with little sub-cluster grouping. To resolve this you can either reprocess your data in the Reanalyze tab, or use desktop tools to remove edges that do not meet minimum values for Cluster and Activity scores.
Community View
NP Analyst includes a tool to automatically identify communities within the full network. These communities share high interconnectivity between sample nodes, meaning that samples in each community are connected by bioactive MS features. Communities can be visualized in the Network View page by selecting the ‘Show Communities’ toggle.
Alternatively, the Community View provides detailed information on each community, including a suite of plots to assist with interpretation and bioactive feature selection. For detailed descriptions of these plots see the Communities section of the documentation.
At the top of the page are arrows to allow you to move between communities (A). Within each community page are four plots.
- The network plot (B) illustrates the samples and MS features that are part of the community.
- The top right panel is a plot of retention time vs m/z value for all MS features (C). Data points are sized and color coded by Activity and Cluster score. Typically, bioactive molecules afford large red data points in this plot.
- The middle right plot is Cluster Score vs. Activity Score (D). Cluster Score defines the consistency of the phenotype for each MS feature. Bioactive molecules should always have high Cluster Scores. Activity Score defines the strength of the phenotype, which is governed by the spectrum of activity. Narrow spectrum bioactives (active against a single parameter in the bioassay file) will have high Cluster Scores but low Activity Scores, while broad spectrum bioactives will have high scores in both metrics. Lead selection therefore depends on the objective of the study, as MS features with low Activity Scores can still be of interest in targeted drug discovery programs.
- Finally, the bottom right heatmap (E) presents the bioassay input data for the samples in the cluster, grouped by biological phenotype. This can be useful for identifying sub-populations of bioactive profiles within a given community, which can help with lead selection.
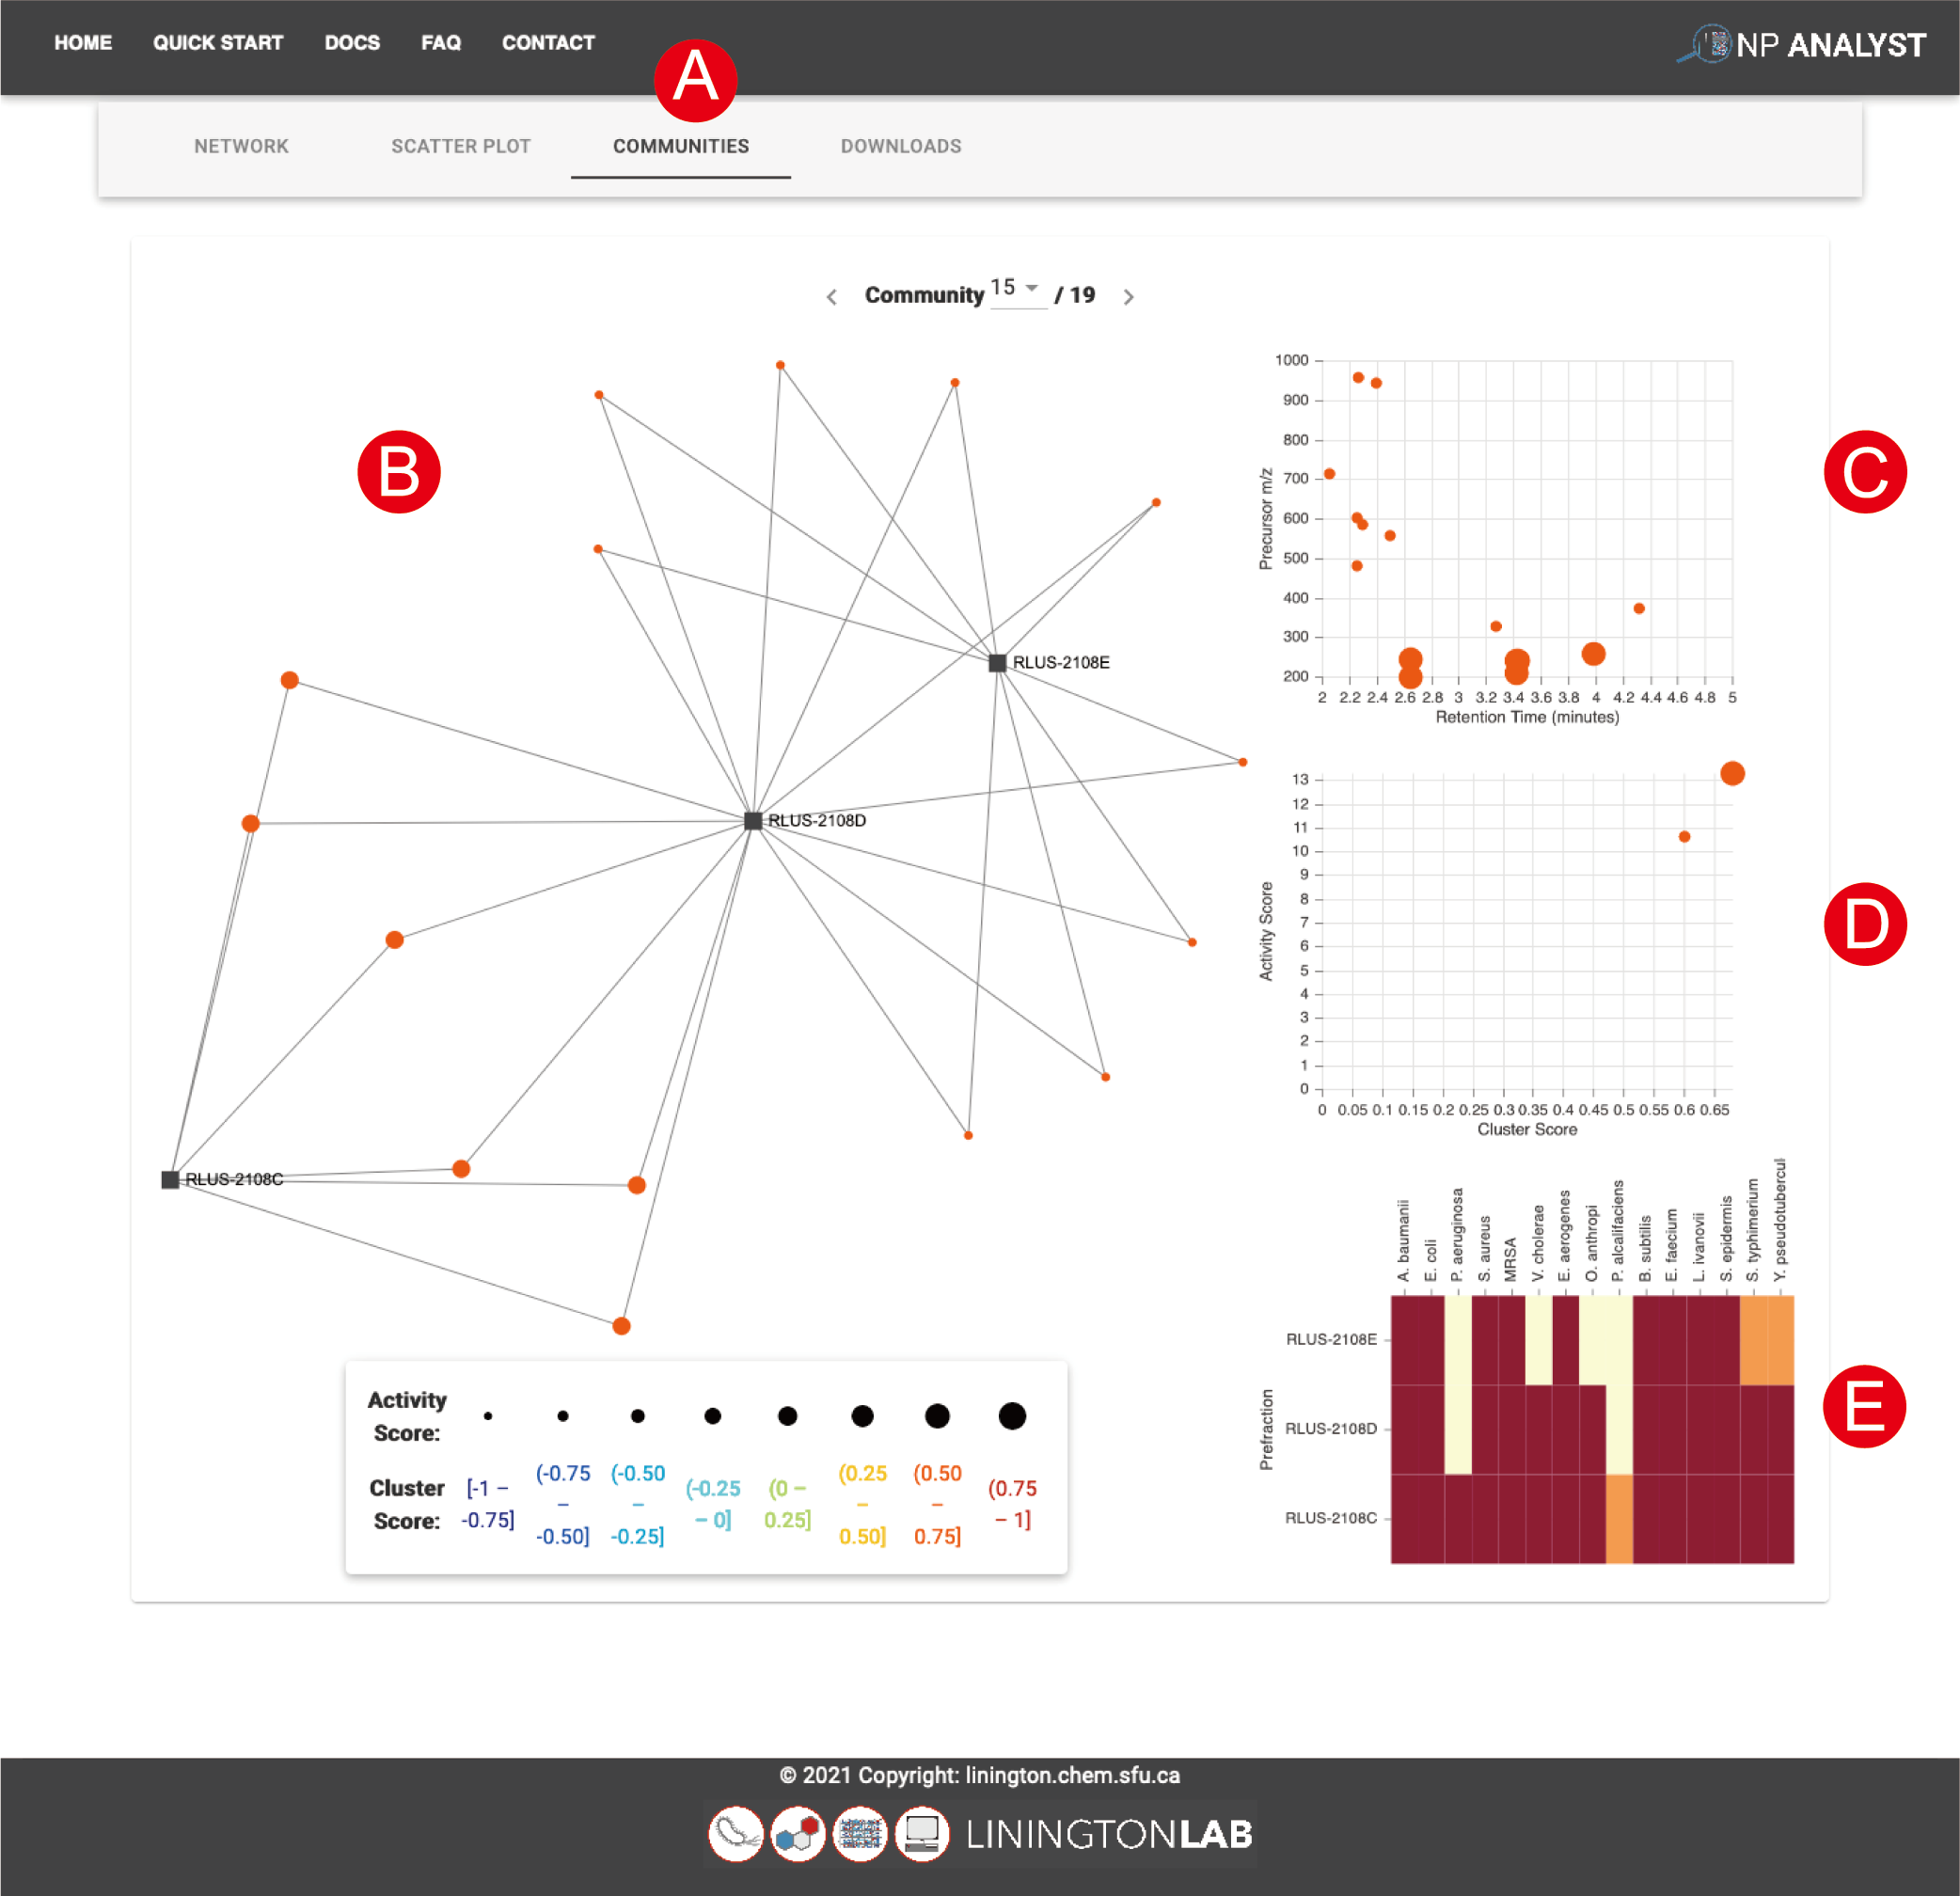
The plots on the Community view are interactive and interconnected. Clicking on a data point in any plot highlights its position in the other plots on the page, making it easy to track and interrogate priority features. MS features with high cluster scores and MS features that connect several extracts in the network view are both examples of priority features with strong bioactivity predictions.
STEP 7: Download Results
NP Analyst does not store input file (bioassay and MS files) but does store results files for 6 months. You can return to these results at any time using the job ID, or by following the link in the results email. Alternatively, you can download your results in one of four formats for offline use. For details in the download formats, see the Downloads section of the documentation.