File Import
Sample Naming Conventions
In order to integrate data from the bioassay and MS files, sample names must be consistent between the two files. The first column in the bioassay file is reserved for sample names. Each sample must have a unique name in the list without any repetition. NP Analyst uses this list to match samples in the bioassay file to samples in the MS data. If you are using MZMine or GNPS files for your MS data then the sample names should exactly match between the bioassay and MS files.
NOTE: If you are uploading mzML files then the mzML filename must follow the convention SAMPLENAME_REPLICATE.mzML where SAMPLENAME is the same as the sample name in the bioassay file, and REPLICATE identifies different replicate analyses. You must include an underscore and a replicate term even if you only have one replicate MS file for each sample. By default we use ‘_R1’ as the suffix for mzML files.
Sample names are connected using substring matching, so it is possible to include replicate numbers, date stamps etc. in the MS sample names. It is recommended to restrict sample names to letters, numbers and underscores (_). Other punctuation (including spaces) is permitted, however neither the comma (,) nor the vertical bar (|) are allowed.
Bioassay file
File Naming
There are no restrictions to the file name that can be used for bioassay files, provided it is in the correct format (see below).
File Format
The bioassay file must be a single ‘flat’ table saved in UTF-8 CSV format. To create this format from Excel select File→ Save As…→ CSV UTF-8 (Comma delimited) (.csv).
An example file can be downloaded here. This file was used to create the NP Analyst study.
Download bioactivity table
File Structure
Each bioassay file should start with a ‘header’ row containing column titles. NP Analyst does not read bioassay data from the first row so a header row must be included to prevent data loss. Column titles can be in any format, but must not include commas or slashes. Column titles should describe each assay or readout to help with interpreting potential errors raised by the online interface.
The bioassay file should be structured so that each row contains data for a single sample, and each column contains data for a different bioassay readout. Column 1 is reserved for sample names. These names are used to link the bioassay data to the MS data, so there must be alignment between the sample names in the two files (see above). The following columns should each contain data from a single bioassay readout.
Any number of columns is permitted. Typical files contain 5 - 20 columns, though we have successfully run NP Analyst with up to 250 bioassay columns. There is no restriction on the number of samples that can be analyzed. Typical numbers of samples range from 50 - 1000.
Allowed Bioassay Types
NP Analyst will accept almost any bioassay format including IC50, IC90, LD50, MIC, %G, %inhibition, live/dead, etc. The bioassay file can contain either numerical or Boolean (TRUE/ FALSE) data. The only restriction is that each column must contain a single data type. You must create a new column for each bioassay readout.
Bioassay columns can either be multiple readouts from a single assay (e.g. gene expression profiling or image-based screening) or single readouts from multiple bioassays (e.g. antibacterial activity against a panel of pathogens). Because every molecule has an activity profile across all of biological space, it is appropriate to use assays for different targets in the same analysis. For example, including activities against a bacterial strain, a fungal strain, an immortalized human cell line and one or more protozoan parasites would be an appropriate bioassay dataset for use with NP Analyst. In general, increasing the information content in the bioassay file will have a positive effect on bioactive analyte prediction.
Data Normalization
Although not required, we strongly encourage users to normalize the bioassay files prior to upload, particularly if the file contains data from several different bioassays with different readouts (e.g. MIC and %inhibition). Ideally, data in each column should be in the range 0 - 1, with 0 signifying no activity and 1 signifying complete activity. For example, a column containing live/ dead data would include 0 for all live entries, and 1 for all dead entries. Similarly, a column containing percent growth would contain continuum data from 0 (100% growth) to 1 (no growth). Because bioassays come in a wide array of formats and data types, NP Analyst does not perform this normalization automatically. However, simple manipulations in Excel are typically sufficient to reformat raw bioassay data into a normalized format.
If columns contain potency values (e.g. MIC or LD50) we recommend defining an activity range from inactive to most potent, and reformatting these results on a normalized inverse log scale. This ensures that very potent samples with low values in the original data (e.g. 5 nM) will have large positive values in the transformed data, while weakly active samples (e.g. 128 µM) will have low values in the transformed column.
Finally, some bioassay types report both positive and negative values. These are accepted by the NP Analyst platform. We recommend normalizing these values in a scale -1 to +1 where possible.
mzML files
File Naming and Replicate Designation
File naming for mzML files is complicated, and must comply with several format requirements. MS filenames must contain the same sample name that is listed in the bioactivity file. We use substring matching to align bioactivity and MS data, so MS filenames with extra data (e. g. date stamps) are permitted, provided that the sample name and extra data are separated by a dash or a period. For example, sample RLUS1234E will be recognized from MS filename RLUS1234E-20210707_R1.mzML because the sample name is a subset of the full filename. Sample names must be consistent between the two data sources, so extra spaces, dashes or punctuation in the sample name are not accepted.
In addition, mzML filenames are used to identify different replicates of the same sample. All mzML filenames must possess the general structure SAMPLENAME_REPLICATE.mzML. SAMPLENAME must contain the sample name from the bioassay file and may optionally include additional characters (as described above). REPLICATE must be different for all replicates, but can be any combination of characters. For example,
RLUS1234E_R1.mzML
RLUS1234E_R2.mzML
RLUS1234E_R3.mzML
would be recognized as replicates of the same sample.
The delimiter between SAMPLENAME and REPLICATE must be underscore (‘_’). Spaces or other punctuation are not permitted as the replicate delimiter.
The page in the web version of NP Analyst that handles mzML import includes tools to allow users to rename and reorganize files to group replicates correctly. It is possible to double click on filenames to change them in the uploader. The interface will automatically regroup files into replicates based on these changes, providing graphical feedback on the interpretation of these changes by the system. If replicates are present then the same number of replicates must be present for each sample before the submit button is activated.
File Format
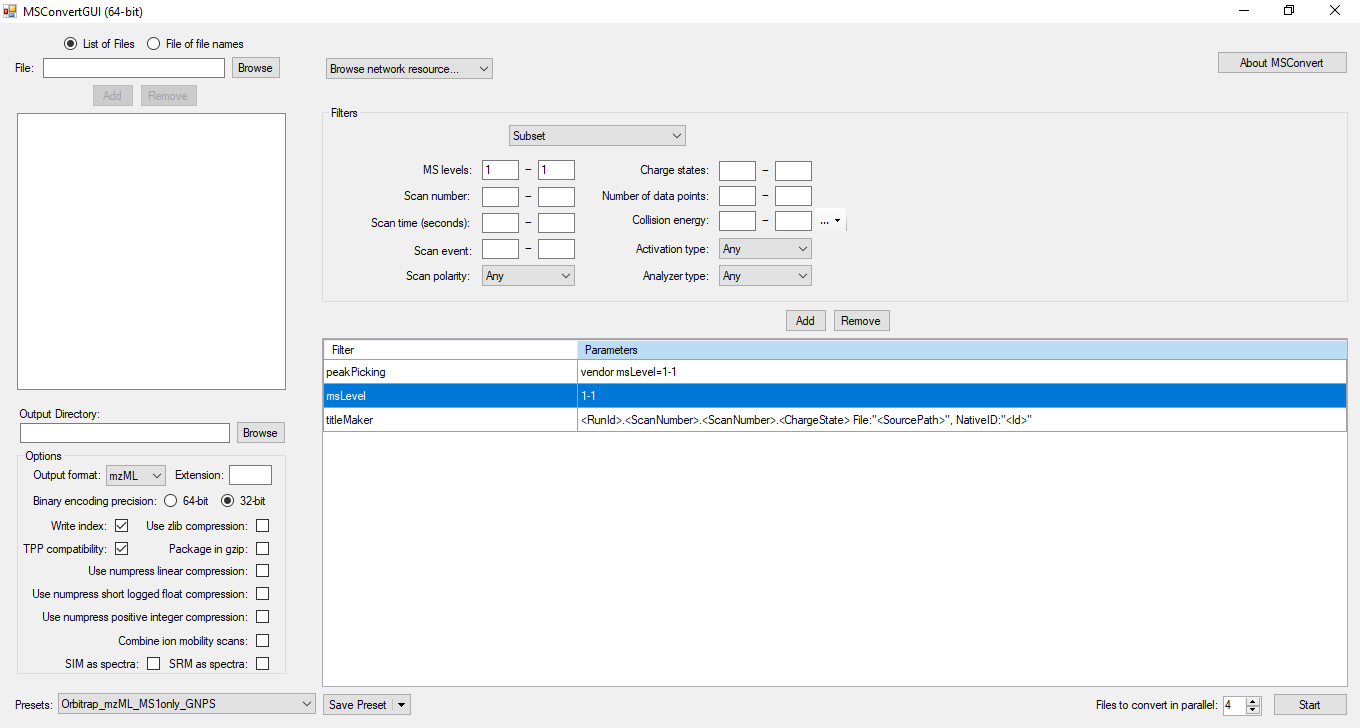
We recommend MSconvert from ProteoWizard to convert .raw files to mzML format. Other vendor-specific convertors will probably work, but we have not tested mzML exports from commercial MS software packages.
Because NP Analyst only uses MS1 data for MS feature extraction we recommend that users only include MS1 data in the MSconvert process. This has the advantage that it will dramatically improve upload times to the NP Analyst website. To convert raw data to mzML using MSconvert, please use the settings indicated in the screenshot below.
Zip File Option
In addition to uploading a set of mzML-files, the online version of NP Analyst also accepts the compressed .zip file format, whereby one zip file contains all the mzML files. We highly recommend to use this option when the number of samples is high (>20) or if the upload of individual samples fails.
An example zip-file can be downloaded here. This file contains the mzML raw files used for the NP Analyst study.
Download zipped mzML files
NOTE: Currently we cannot accept zip files from the native Mac OSX ‘compress’ tool because this creates hidden files in the zip that interfere with the uploader. A solution for Mac users is to use the third party compression tool Keka and to select the ‘Exclude Mac resource forks’ checkbox
Intensity Cutoffs
NP Analyst provides the option to set intensity cutoffs for MS data. This is recommended to exclude the often very large number of baseline data points present in raw MS files. Retention of all baseline signals dramatically increases analysis times, and occasionally leads to large, heavily interconnected networks that are difficult to interpret.
To determine appropriate cutoffs we recommend that users manually inspect scans at several positions in the chromatogram and identify the intensity value of the noise floor. Because the goal of NP Analyst is to identify diagnostic MS features from bioactive metabolites as ‘handles’ for compound isolation it is not necessary to capture every MS feature from every analyte in the sample set. Setting appropriate intensity cutoffs that remove the electronic and background noise from MS data simplifies both analysis and interpretation, and helps to prioritize features with high Activity and Cluster scores. In rare cases where all MS features from a bioactive metabolite are very low intensity the results file will not include any high priority candidates for those samples. In these cases, the analysis can be re-run with a lower intensity cutoff.
In our experience, increasing the MS intensity cutoff above the noise threshold has little impact on bioactive metabolite prioritization, but dramatically improves analysis times and simplifies results plots. As an alternative to manual inspection of input data, users can select intensity cutoffs from the table below. Note that these are ballpark recommendations based on user feedback, and may need to be modified for your instrument.
| Manufacturer | Model | Suggested Intensity Cutoff |
|---|---|---|
| Waters | SYNAPT G2Si | 2000 |
| Xevo | ||
| Vion | ||
| RDa | ||
| Thermo | Orbitrap | 1e5 |
| Agilent | 6530 | |
| Bruker | timsTOF |
MZmine files
As a comprehensive metabolomics toolbox, MZmine allows users to create peak lists from MS raw data in the .mzML open-source format, but also supports certain vendor-specific raw file formats. We recommend users to use the latest MZmine build (≥ 2.53) and follow the developer guidelines and publicly available tutorials, which can be found here:
In brief, NP Analyst-readable peak lists are created in MZmine in a step-by-step process:
- Mass detectionChromatogram-building
- Chromatogram deconvolution
- Isotope grouping
- Alignment
- Peak filtering (optional, but recommended)
- Gap-filling (Might overestimate peak presence, NOT recommended*)
- Export peak list in comma-delimited .csv format
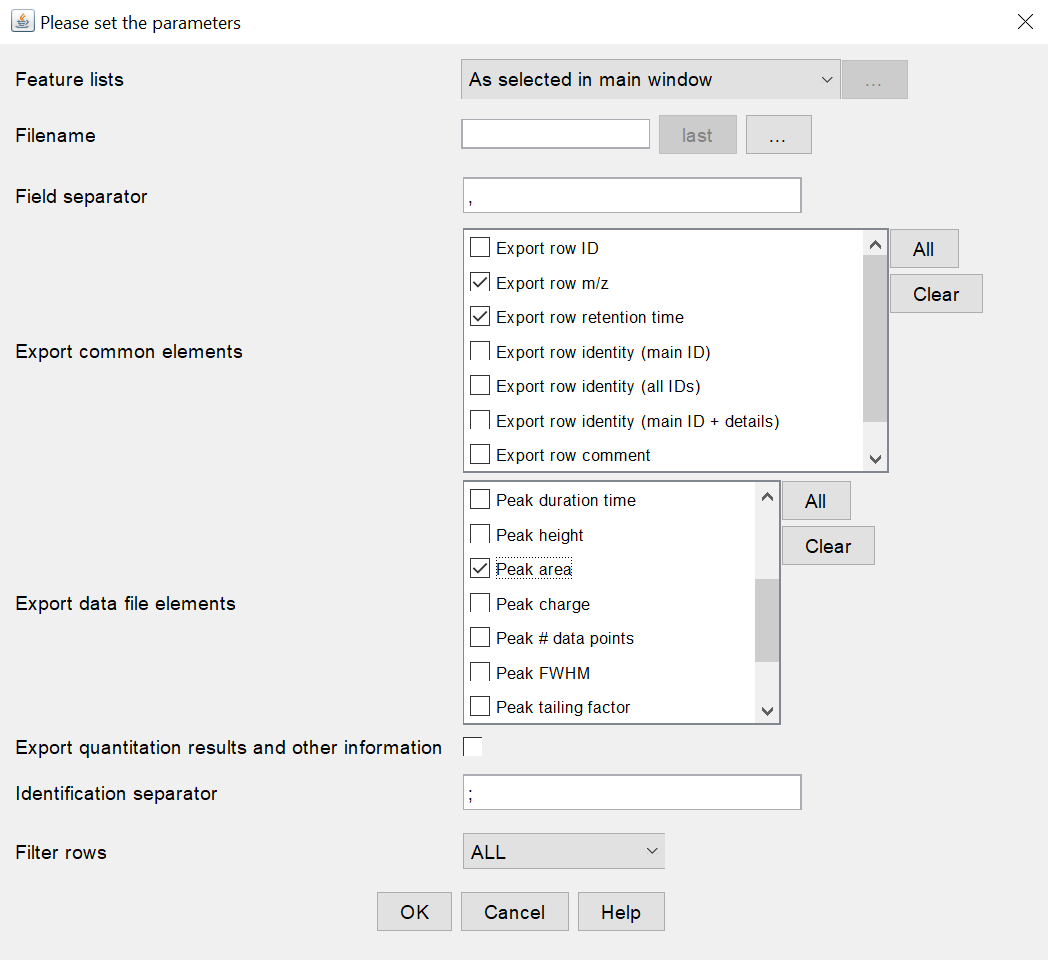
In order to allow NP Analyst to read the .csv file properly, the following export settings must be selected (see settings screenshot below, MZmine 2.53): Export common elements section
-
Export row m/z
-
Export row retention time
Export data file elements
- Peak area
* NP Analyst does not interpret intensities quantitatively, but converts zero and non-zero intensities into a peak presence and absence table. Even the smallest non-zero intensity would indicate the presence of a peak. Therefore, Gap-filling might overestimate the presence of peaks in the dataset that correlate with activity.
GNPS files
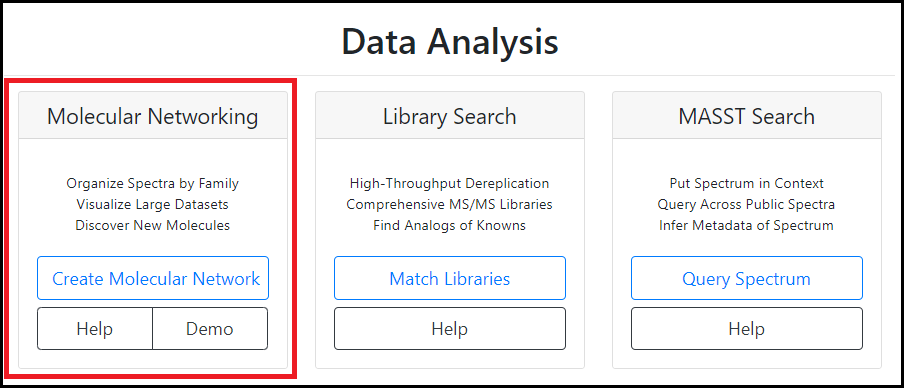
Global Natural Product Social Molecular Networking (GNPS) allows users to visualize structural relatedness of complex chemical mixtures based on shared MS/MS features. In order to create a GNPS network and get to know the platform better, we recommend users to follow the official tutorials offered by the developers and create a GNPS account.
In general, the GNPS workflow consists of three steps: MS raw data file upload, parameter selection, and the analysis itself. One of the result files that is created by the GNPS pipeline is the .graphml network file. This graphml file serves as the MS input file for NP Analyst and accompanies the activity .csv table. In terms of compatibility, only the result file of the classic Molecular Networking GNPS analysis is supported by NP Analyst (see attached GNPS web platform screenshot). Feature-based molecular networking (FBMN) is not supported, yet.