Inspection tab
The inspection tab offers users the options to create quantile-quantile-plots and visualize variable correlation pattern.
Quantile-Quantile plots
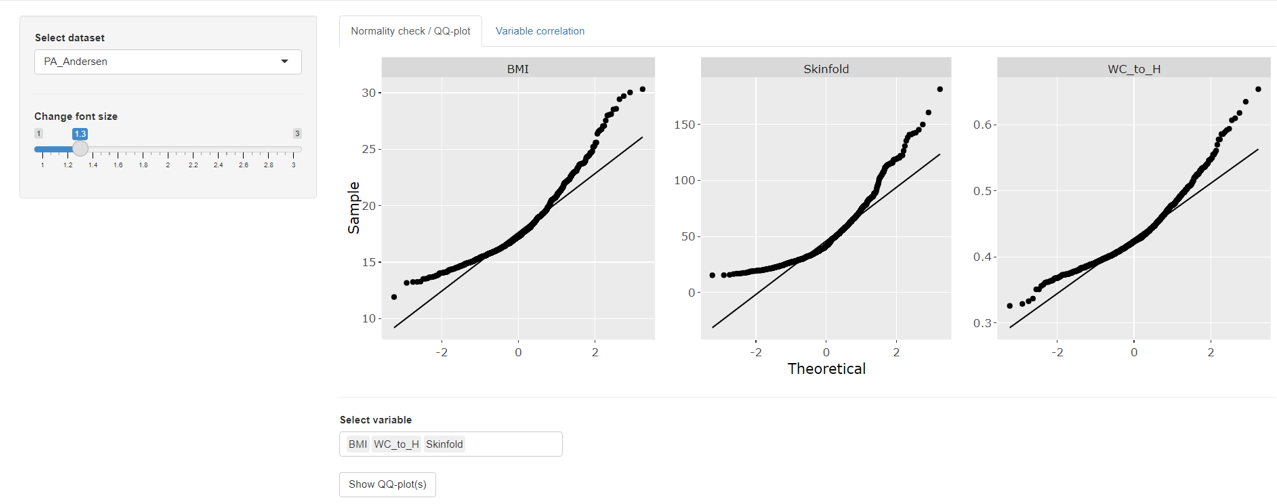
The purpose of quantile-quantile plots (QQ-plots) is to check whether a variable shows a normal distribution. If a variable is perfectly normally distributed each data point will follow the faint black diagonal which represents a theoretical normal distribution for the given data.
mvpaShiny allows to show several QQ-plots side-by-side, using the multiple selection field.
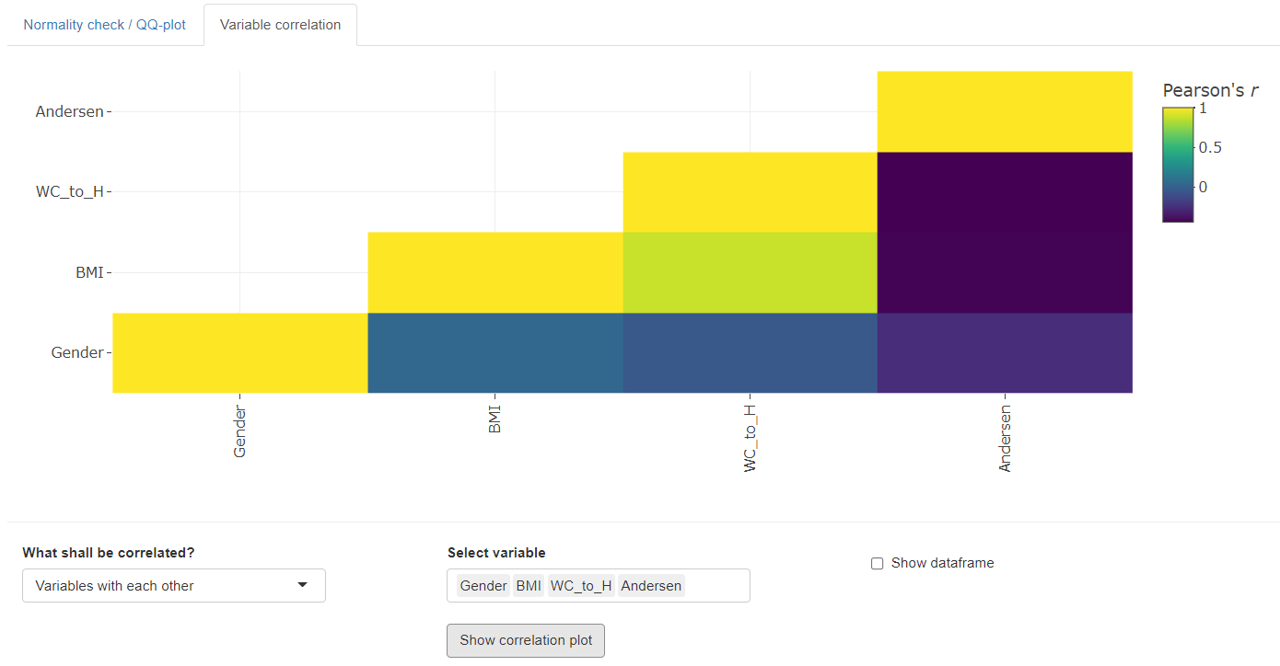
Correlation plots
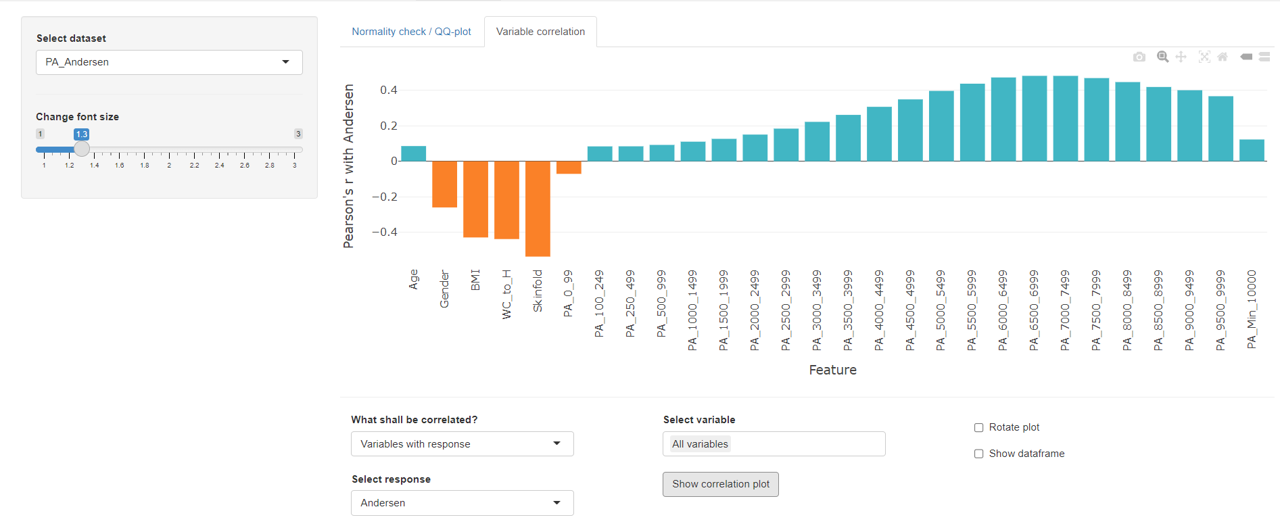
mvpaShiny can plot two types of correlation:
- Variables with (a single) response. The plot can be rotated by 90° for easier interpretation.
- Variables with each other