General concepts
Dataset selection
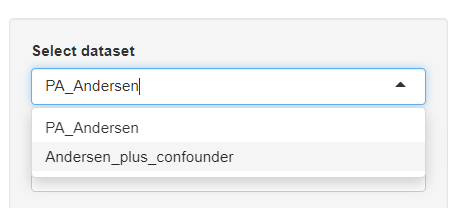
Each analysis tab (inspection, principal component analysis etc.) allows the user to freely switch between available verified datasets.
Download / copy datasets
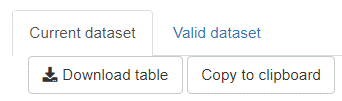
The majority of visible graphics-underlying tables can be downloaded and also directly copied to the clipboard for easy transfer to external software like Microsoft Excel. Most graphics have a Show dataframe button that toggles the underlying table of the shown graphic.
Handling and saving figures
All graphics in mvpaShiny are generated by plotly an open-source graphics package (link).
The graphics funtionalities

Each graphic has mouse-over menu that appears when the mouse cursor is hovered over the graphic (top right corner). Description of the individual symbols:
- The camera symbol allows to save the shown graphic as .png
- The magnifying glass symbol allows zooming
- The pan symbol allows to move the shown graphic within the boundaries
- The autoscale symbol scales the shown graphic and fits its content appropiately
- The reset axes symbol (little house) resets the graphic to its original state
- The show closest data on hover symbol (single arrow) highlights the selected datapoint or bar
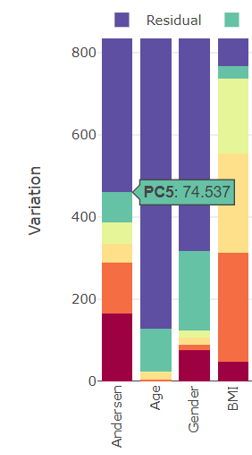
- The compare data on hover symbol (two arrows) highlights all values within one stacked bar plot
In addition, all graphics come with a change font size slider bar and an option to change the size of points in point plots.
Examples
Simple mouse over
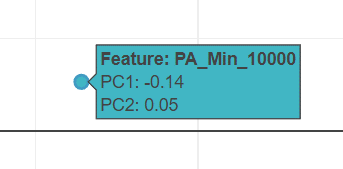
Show closest data on hover
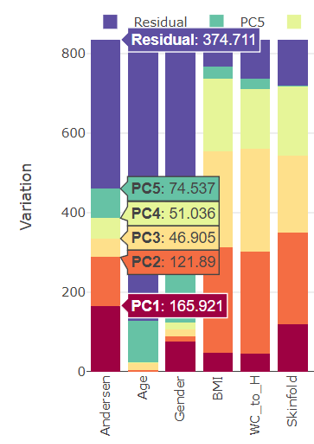
Compare data on hover